Operations Dashboard
Unified view of operational metrics including hashrate, power consumption, site efficiency, and miner counts over time.
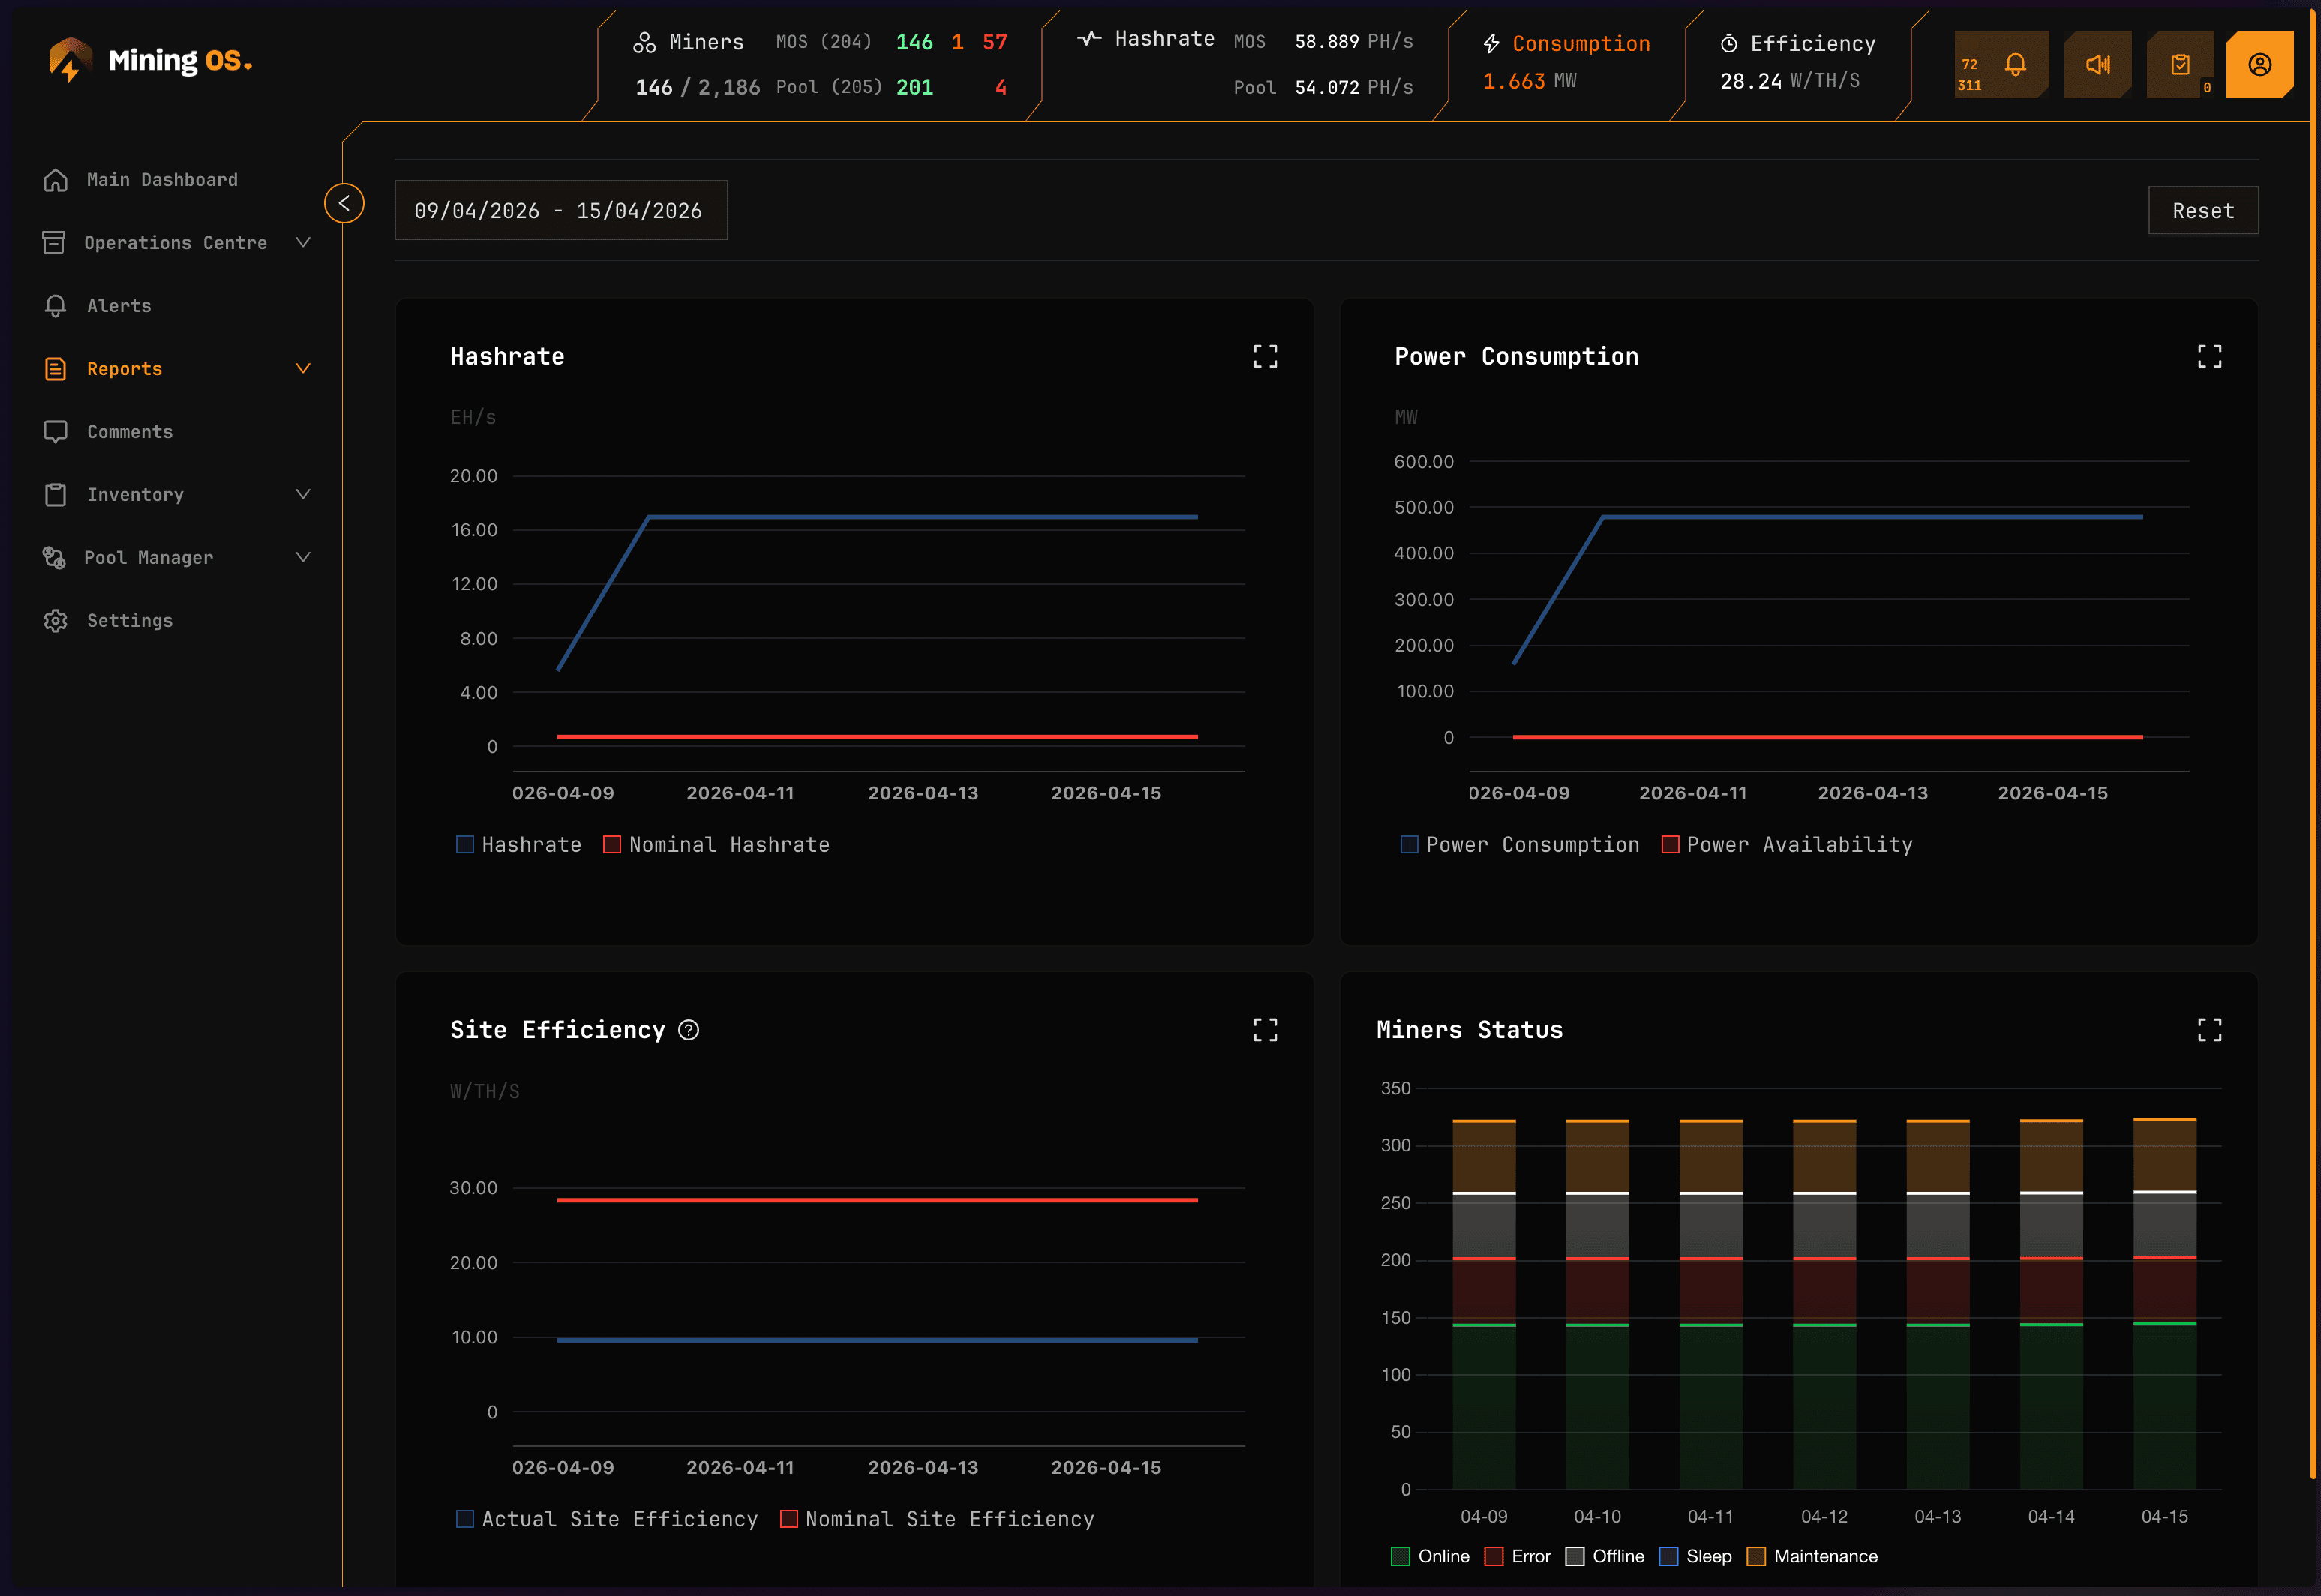
The Operations Dashboard provides a consolidated view of your mining operation's key performance indicators over time. It displays four chart panels covering hashrate, power consumption, site efficiency, and miner fleet status.
For real-time monitoring, see the main Dashboard. For detailed analysis of individual metrics, see the dedicated pages: Hashrate, Energy, Efficiency, and Miners.
Dashboard panels
The Operations Dashboard presents four synchronized chart panels, all responding to the same date range and view mode selections.
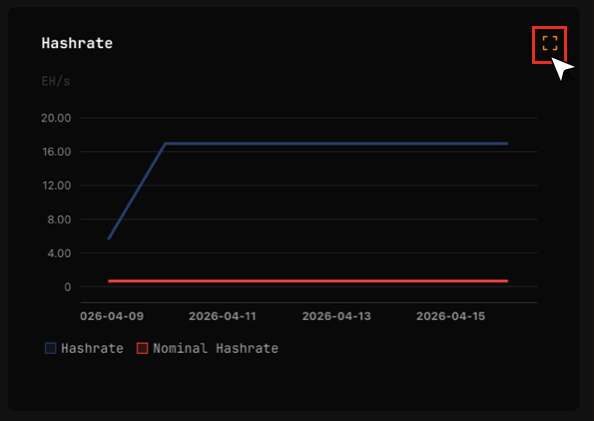
Hashrate panel
Displays total hashrate (TH/s or PH/s) over the selected time period.
| Element | Description |
|---|---|
| Line chart | Hashrate trend over time |
| Y-axis | Hashrate in TH/s or PH/s (auto-scaled) |
| X-axis | Time intervals based on date range |
| Hover tooltip | Exact hashrate value at each data point |
Compare this with the Header hashrate for real-time values. Significant discrepancies may indicate data collection delays.
For detailed hashrate analysis including breakdown by miner type, see Hashrate.
Power consumption panel
Shows total power consumption (kW) across the fleet.
| Element | Description |
|---|---|
| Line chart | Power consumption trend |
| Y-axis | Power in kW |
| X-axis | Time intervals based on date range |
| Threshold line | Site power capacity (if configured) |
For power mode distribution and detailed energy analysis, see Energy.
Site efficiency panel
Tracks fleet-wide efficiency measured in W/TH (watts per terahash).
| Element | Description |
|---|---|
| Line chart | Efficiency trend over time |
| Y-axis | Efficiency in W/TH |
| X-axis | Time intervals based on date range |
| Lower is better | Decreasing values indicate improved efficiency |
Rising efficiency values (higher W/TH) may indicate cooling issues, degrading equipment, or suboptimal power modes. Investigate using Heatmaps and Efficiency reports.
Miners panel
Displays miner counts and status distribution over time.
| Element | Description |
|---|---|
| Stacked area chart | Miner counts by status category |
| Green area | Online miners (normal operation) |
| Orange area | Miners with errors |
| Red area | Offline miners |
| Total line | Total miner count |
For detailed fleet composition analysis, see Miners.
Controls
View mode selector
Switch between aggregation levels:
| View mode | Shows | Use case |
|---|---|---|
| Site View | Entire site aggregated | High-level overview |
| Miner Type View | Breakdown by model | Model comparison |
| Mining Unit View | Breakdown by container/unit | Location analysis |
Date range selector
Select the analysis period using presets or custom range:
| Preset | Description |
|---|---|
| Last 24h | Most recent 24 hours |
| Last 7d | Past week |
| Last 30d | Past month |
| Custom | User-defined start and end dates |
Expand panel
Click the expand icon on any panel to view it in full-screen mode with additional detail.
Use cases
| Scenario | How to use Operations Dashboard |
|---|---|
| Daily standup | Review all four panels for last 24h to identify overnight issues |
| Weekly review | Set to 7-day range, look for trends and anomalies |
| Incident investigation | Set custom range around incident time, correlate across panels |
| Capacity planning | Review 30-day trends for growth patterns |
Related documentation
Operations reports
- Hashrate: Detailed hashrate analytics
- Energy: Power consumption analysis
- Efficiency: W/TH performance metrics
- Miners: Fleet composition tracking
Real-time monitoring
- Dashboard: Live operational metrics
- Header: Real-time status indicators
- Widgets Page: Container-level monitoring
Analysis tools
- Heatmaps: Temperature visualization
- Explorer: Individual miner details
- Alerts Manual: Alert investigation